Barchart
Demonstrates the BarChart
widget. Source: barchart.rs.
git clone https://github.com/ratatui/ratatui.git --branch latestcd ratatuicargo run --example=barchart --features=crossterm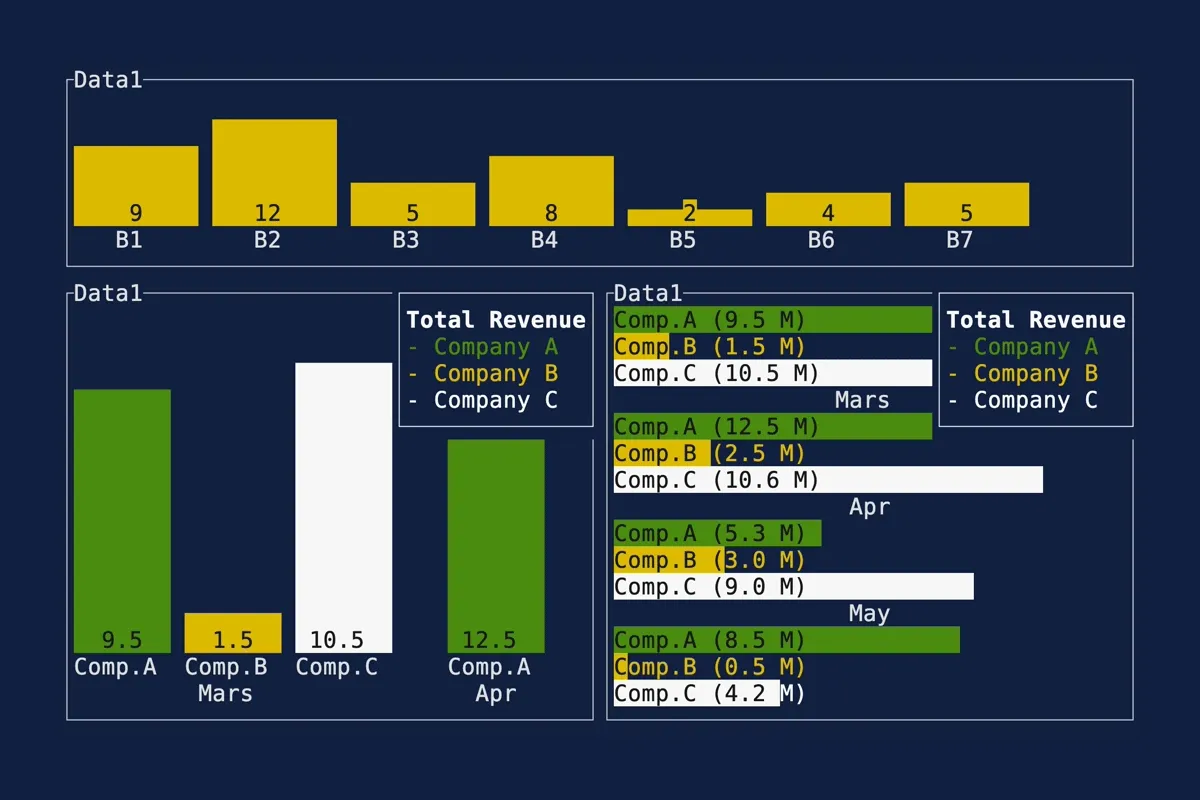
//! # [Ratatui] `BarChart` example//!//! The latest version of this example is available in the [examples] folder in the repository.//!//! Please note that the examples are designed to be run against the `main` branch of the Github//! repository. This means that you may not be able to compile with the latest release version on//! crates.io, or the one that you have installed locally.//!//! See the [examples readme] for more information on finding examples that match the version of the//! library you are using.//!//! [Ratatui]: https://github.com/ratatui/ratatui//! [examples]: https://github.com/ratatui/ratatui/blob/main/examples//! [examples readme]: https://github.com/ratatui/ratatui/blob/main/examples/README.md
use color_eyre::Result;use rand::{thread_rng, Rng};use ratatui::{    crossterm::event::{self, Event, KeyCode, KeyEventKind},    layout::{Constraint, Direction, Layout},    style::{Color, Style, Stylize},    text::Line,    widgets::{Bar, BarChart, BarGroup, Block},    DefaultTerminal, Frame,};
fn main() -> Result<()> {    color_eyre::install()?;    let terminal = ratatui::init();    let app_result = App::new().run(terminal);    ratatui::restore();    app_result}
struct App {    should_exit: bool,    temperatures: Vec<u8>,}
impl App {    fn new() -> Self {        let mut rng = thread_rng();        let temperatures = (0..24).map(|_| rng.gen_range(50..90)).collect();        Self {            should_exit: false,            temperatures,        }    }
    fn run(mut self, mut terminal: DefaultTerminal) -> Result<()> {        while !self.should_exit {            terminal.draw(|frame| self.draw(frame))?;            self.handle_events()?;        }        Ok(())    }
    fn handle_events(&mut self) -> Result<()> {        if let Event::Key(key) = event::read()? {            if key.kind == KeyEventKind::Press && key.code == KeyCode::Char('q') {                self.should_exit = true;            }        }        Ok(())    }
    fn draw(&self, frame: &mut Frame) {        let [title, vertical, horizontal] = Layout::vertical([            Constraint::Length(1),            Constraint::Fill(1),            Constraint::Fill(1),        ])        .spacing(1)        .areas(frame.area());
        frame.render_widget("Barchart".bold().into_centered_line(), title);        frame.render_widget(vertical_barchart(&self.temperatures), vertical);        frame.render_widget(horizontal_barchart(&self.temperatures), horizontal);    }}
/// Create a vertical bar chart from the temperatures data.fn vertical_barchart(temperatures: &[u8]) -> BarChart {    let bars: Vec<Bar> = temperatures        .iter()        .enumerate()        .map(|(hour, value)| vertical_bar(hour, value))        .collect();    let title = Line::from("Weather (Vertical)").centered();    BarChart::default()        .data(BarGroup::default().bars(&bars))        .block(Block::new().title(title))        .bar_width(5)}
fn vertical_bar(hour: usize, temperature: &u8) -> Bar {    Bar::default()        .value(u64::from(*temperature))        .label(Line::from(format!("{hour:>02}:00")))        .text_value(format!("{temperature:>3}°"))        .style(temperature_style(*temperature))        .value_style(temperature_style(*temperature).reversed())}
/// Create a horizontal bar chart from the temperatures data.fn horizontal_barchart(temperatures: &[u8]) -> BarChart {    let bars: Vec<Bar> = temperatures        .iter()        .enumerate()        .map(|(hour, value)| horizontal_bar(hour, value))        .collect();    let title = Line::from("Weather (Horizontal)").centered();    BarChart::default()        .block(Block::new().title(title))        .data(BarGroup::default().bars(&bars))        .bar_width(1)        .bar_gap(0)        .direction(Direction::Horizontal)}
fn horizontal_bar(hour: usize, temperature: &u8) -> Bar {    let style = temperature_style(*temperature);    Bar::default()        .value(u64::from(*temperature))        .label(Line::from(format!("{hour:>02}:00")))        .text_value(format!("{temperature:>3}°"))        .style(style)        .value_style(style.reversed())}
/// create a yellow to red value based on the value (50-90)fn temperature_style(value: u8) -> Style {    let green = (255.0 * (1.0 - f64::from(value - 50) / 40.0)) as u8;    let color = Color::Rgb(255, green, 0);    Style::new().fg(color)}